Hacking your way to Observability — Part 1 : Metrics
Starting your journey in observability by gathering metrics with Prometheus
Have you ever seen someone trying to find how to solve an issue and a dozen people watching or suggesting to him/her what to look for as if they were trying to solve a mystery? . These situations arise more questions than answers, and trying to get the answers can consume most of your time and in the end, it will have an impact on your company.
The “unknown” can be hard to spot or even to understand and that’s where Observability comes in, it gives you the ability to understand what is broken or what is failing and may give you an idea of the “why” so you can continuously improve.
Observability
Observability is defined as a measurement of how well a system’s internal state could be inferred from its outputs (the telemetry). It’s nothing new, we have been trying to understand applications by reading logs since the beginnings of programming, but it became something complex to achieve with the expansion of the cloud, containerization, microservices architectures, polyglot environments, and so on.
The Three Pilars
When talking about Observability you probably end up hearing something about the three pillars. These pillars as commonly referred to, are the telemetry, they are the formats that can be aggregated and analyzed to understand the state of a system.
- Metrics
- Traces
- Logs
During this series, I will cover all the pillars with examples. We will start with Metrics and an Open Source software called Prometheus.
Metrics
A metric is a numeric value recorded over a period of time such as counters, timers, or gauges. These are very cheap to collect because numeric values can be aggregated to reduce the data transmission to the monitoring system. Normally we use metrics to determine the health of a system because are very well suited to describe a resource status. Also, you can instrument your code using libraries like prometheus_client or prometheus_exporter to emit your custom metrics like Response Time, Active Requests, Error Counters, etc.
Prometheus
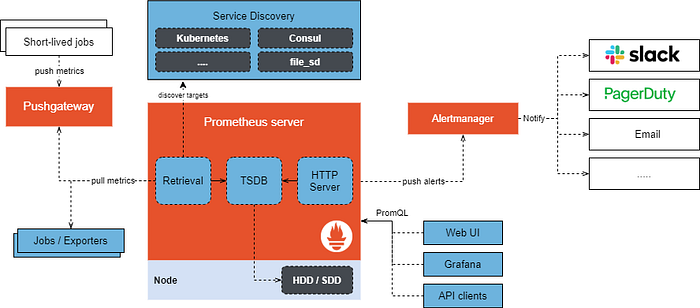
Prometheus is an open-source metrics-based monitoring and alerting system originally developed by SoundCloud and now hosted by the Cloud Native Computing Foundation. It collects metrics about your infrastructure and applications.
Prometheus consists of multiple components:
- Prometheus server: component that scrapes the metrics and stores the time series data.
- Client libraries: libraries to generate metrics on your application.
- Push Gateway: is an intermediate component that allows you to push metrics from jobs that cannot be scraped.
- Alert Manager: Handles alerts send by Prometheus. It group, deduplicate and route the alerts to the correct receiver.
- Exporters: Component that fetches statistics from another system and turns those into Prometheus metrics.

Deployment
You can deploy Prometheus in many ways: installing it on your infrastructure, manually on containers or Kubernetes, via helm with or without the operator on Kubernetes. To keep it simple we will deploy Prometheus using the helm chart with the Prometheus operator.
kubectl create namespace observability
helm repo add prometheus-community https://prometheus-community.github.io/helm-charts
helm repo update
helm install prometheus prometheus-community/kube-prometheus-stack --namespace observability
At the time of writing, Prometheus is at version 2.26, it has new features that vastly improve the experience. If you want to know more: https://github.com/prometheus/prometheus/releases/tag/v2.26.0
When the deployment finishes, you will see the following pods:
NAME                                                     READY   STATUS    RESTARTS   AGE
alertmanager-prometheus-kube-prometheus-alertmanager-0   2/2     Running   0          69m
prometheus-grafana-5c469b9cbf-kn2zk                      2/2     Running   0          69m
prometheus-kube-prometheus-operator-68d59d8d59-gvkzk     1/1     Running   0          69m
prometheus-kube-state-metrics-685b975bb7-rhstl           1/1     Running   0          69m
prometheus-prometheus-kube-prometheus-prometheus-0       2/2     Running   0          69m
prometheus-prometheus-node-exporter-mn68b                1/1     Running   0          69m
To access Prometheus, we will forward a local port to the Prometheus service port.
kubectl port-forward service/prometheus-operated -n observability 9090
Forwarding from 127.0.0.1:9090 -> 9090
Forwarding from [::1]:9090 -> 9090
As you can see, we already have some metrics. This is because of kube-state-metrics pod, which is a service that listens to the Kubernetes API and generates metrics about the state of Kubernetes objects.
To interact with these metrics and aggregate them you can use the PromQL (Prometheus Query Language). The result of the query can be seen as tabular data or as a graph.
There are 4 types of metrics:
- Counter: The value can only increase or be reset to 0.
- Gauge: The value can increase or decrease.
- Histogram: It exposes multiple time series — Cumulative counters for buckets, Sum of the observed values, and a general counter for the events.
- Summary: It similar to a histogram, it provides the sum of observed values and a counter for the events but it also provides the calculation for φ-quantiles.
it is possible to obtain the φ-quantiles on histograms as well, using the function
histogram_quantile, but the calculation is done on the server-side instead of the client-side like in Summaries.
Exposing Metrics
Ok, that’s enough of theory… how do we make Prometheus gather our applications/services metrics?
First, we need to expose some metrics, to do that we will use the nodejs Prometheus client. This client already comes with some default metrics, so we can get something done very fast.
To expose the metrics we just need to create the registry and tell the client to collect the default metrics.
Then, we expose those metrics through the /metrics endpoint
And… Voila!, we have metrics.

To create custom metrics we have to decide what type of metric we want and then configure and register it. All the metric types allow you to configure labels, which gives you more context about the metrics and work as filters too. On histograms, you can configure buckets that will group and count the values that fall within the limits of each bucket.
With the metrics configured, you need a method to observe the values. We have a middleware function per metric to do that for us.
The middleware functions will then, be loaded by express.
Sample Application
All the resources used in this series are available in the following github repository: https://github.com/jonathanbc92/observability-quickstart/tree/master/part1
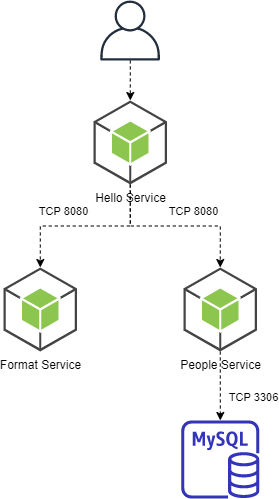
The application we will use for this entire series will be deployed on minikube. It will be composed of 3 Nodejs containers:
- People Service: Service with a simple query to get data from a table in MySQL.
- Format Service: Service that will format a message using the values from the People Service.
- Hello Service: Service that will call the previous services and send the final message to the user.

All the microservices have the default and custom metrics already implemented in the metrics.js file.
To deploy everything (including Prometheus), just execute the make command.
You can test the application by port-forwarding a port to the hello service port 8080 and then make a request to localhost:8080/sayHello/{name}
curl http://localhost:8081/sayHello/iroh
Hey! this is iroh, here is my message to you:  It is important to draw wisdom from many different places
Service Monitoring
Before explaining how to collect the metrics, it is important to understand that deploying Prometheus with or without the Operator changes the configuration required to identify the target services.
On a Prometheus that is deployed without the Operator, you configure the targets on a configuration file.
scrape_configs:
  - job_name:       'node'    # Override the global default and scrape targets from this job every 5 seconds.
    scrape_interval: 5s    static_configs:
      - targets: ['localhost:8080', 'localhost:8081']
        labels:
          group: 'production'      - targets: ['localhost:8082']
        labels:
          group: 'canary'
When you deploy with the Operator you need to create some custom resources called ServiceMonitors. The Service Monitor specifies how the Kubernetes services are monitored and it will generate the scrape configuration automatically.

The Service Monitor custom resource will match the services with the labels specified in the matchLabels parameter within the namespaces specified in the namespaceSelector. A service can expose many ports, so it is important to specify the port and path from where the metrics will be collected.
Check the labels included on the ServiceMonitor; it is important to mention that Prometheus won’t select the Service Monitors that don’t have the required labels. Which labels are these? If we check the Prometheus custom resource specs, we will see the following:
kubectl get prometheuses prometheus-kube-prometheus-prometheus -n observability -o yamlalerting:
    alertmanagers:
    - apiVersion: v2
      name: prometheus-kube-prometheus-alertmanager
      namespace: observability
      pathPrefix: /
      port: web
  enableAdminAPI: false
  externalUrl: http://prometheus-kube-prometheus-prometheus.observability:9090
  image: quay.io/prometheus/prometheus:v2.26.0
  listenLocal: false
  logFormat: logfmt
  logLevel: info
  paused: false
  podMonitorNamespaceSelector: {}
  podMonitorSelector:
    matchLabels:
      release: prometheus
  portName: web
  probeNamespaceSelector: {}
  probeSelector:
    matchLabels:
      release: prometheus
  replicas: 1
  retention: 10d
  routePrefix: /
  ruleNamespaceSelector: {}
  ruleSelector:
    matchLabels:
      app: kube-prometheus-stack
      release: prometheus
  securityContext:
    fsGroup: 2000
    runAsGroup: 2000
    runAsNonRoot: true
    runAsUser: 1000
  serviceAccountName: prometheus-kube-prometheus-prometheus
  serviceMonitorNamespaceSelector: {}
  serviceMonitorSelector:
    matchLabels:
      release: prometheus
  shards: 1
  version: v2.26.0
The serviceMonitorSelector parameters tells us which are the required labels for our ServiceMonitor to be able to be selected by Prometheus.
Now we just need to create the ServiceMonitor:
kubectl apply -f k8s/config/prometheus/servicemonitoring.ymlIf everything worked correctly, on Prometheus’s Status menu, go to Targets. We should see all the pods related to the monitored services.

As soon as new metrics are available, you will be able to query them on the expression browser.

Exporters
We already covered the NodeJS services, but what happens with MySQL? It is important to collect metrics from the database too. To export existing metrics from 3rd party system as Prometheus metrics we can use exporters.
There are many exporters available, you can see some of them here: https://prometheus.io/docs/instrumenting/exporters/
We will use the official MySQL exporter image and it will run alongside the MySQL container. The image requires an environment variable DATA_SOURCE_NAME which value will be taken from a secret. Since all the containers within a pod share the network we can use localhost to connect to MySQL.
kubectl create secret generic mysql-credentials --from-literal=username=root --from-literal=password=admin --from-literal=datasource="exporter:exportpass@(localhost:3306)/tutorial" -n applicationsAfter creating the resources on Kubernetes, in Prometheus Targets we should see the following:

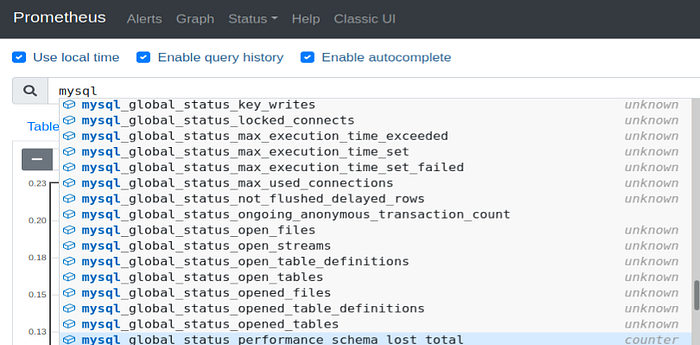
If we check Prometheus expression browser, we will see that we have MySQL metrics available.

Now we can use the rate function to see the average rate of how many select commands has increased over a period. But these values are only the selects that are being executed by the exporter to gather the metrics.

If we do the same with delete commands we will see that it’s 0 because there hasn’t been any delete command executed.

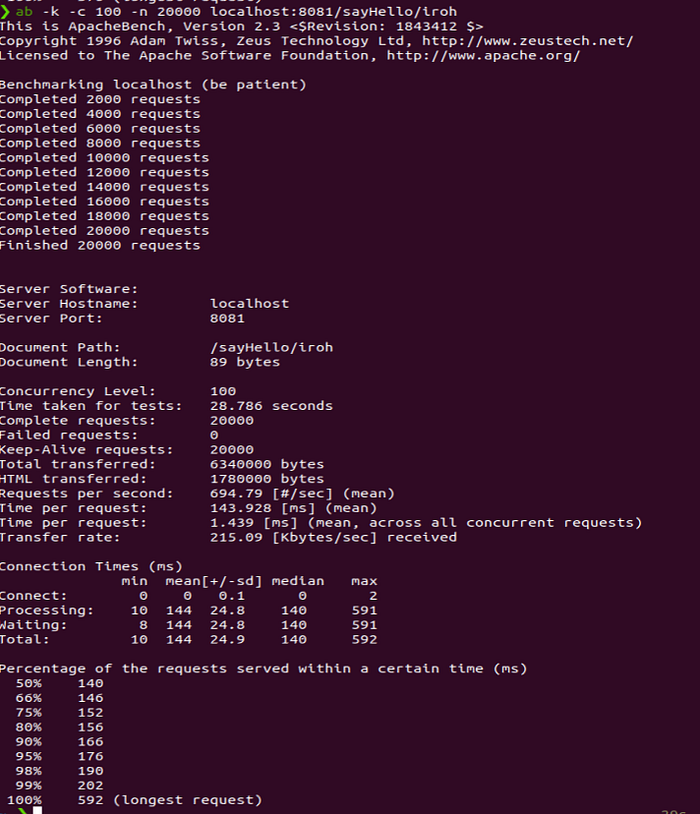
With the help of Apache Benchmark, we can do some load testing to create an spike.


Conclusion
As you can see, it’s really easy to start with Prometheus using the helm chart, with a couple of minutes and a minikube you are ready to go. Even though it may be interesting to see the metrics the first time, metrics by themselves don’t do much. The next time we’ll see alerts.
Happy conding!
